A raster image is the same type of image that you have been taking with a digital camera or your phone.
Old ArcMap Video:
What makes rasters unique from vector data is that rasters cover a rectangular area with a uniformly spaced grid of cells, also known as "picture elements" or "pixels".
In GIS, we use rasters to represent the value or attribute of a real world entity or phenomenon. A Digital Elevation Model, or DEM contains pixels where each pixel contains the average elevation of the land the pixel covers. The Image below shows a DEM of Humboldt County. Each successive image shows what happens when we zoom in. Eventually the pixels are quite large and then, using BlueSpray, we can overlay the values that represent each pixel. These values are really what we are interested in for spatial analysis rather than what the image looks like.
![]()
In a raster, the cells,are arranged in rows and columns. Note that the columns go from 0 on the left to the number of horizontal pixels -1 on the right. The rows start at 0 on the top and increase GOING DOWN to the number of vertical pixels - 1. Rasters are one of the only formats that increases going down and this is opposite of the spatial coordinate systems.

All cells in a raster appear to be the same size in a GIS application but may represent an area on the ground that has a different width than height. Also note that while the cells are always "rectangular" the original pixels when the data was remotely sensed was probably larger and more of an ellipse. This is due to the optics in the sensor. The bottom line is don't expect the pixels to exactly represent what is on the ground.
You've seen the table below before, when we were talking about attributes. For a refresher, remember that this table represents the ways that computers represent data.
| Name | Number of Bits | Number of Bytes | Minimum Value | Maximum Value | Number of Values | Significant Digits |
| Bit | 1 | 1/8 | 0 | 1 | 2 (21) | <1 |
| Chew | 2 | 1/4 | 0 | 3 | 4 (22) | <1 |
| Nibble | 4 | 1/2 | 0 | 15 | 16 (24) | >1 |
| Unsigned Byte | 8 | 1 | 0 | 255 | 256 (28) | >2 |
| Signed Byte (aka chars) |
8 | 1 | -128 | 127 | 256 (28) | >2 |
| Unsigned Short | 16 | 2 | 0 | 65535 | 65536 (216 or 64k) | >4 |
| Signed Short | 16 | 2 | -32768 | 32767 | 65536 (216 or 64k) | >4 |
| Unsigned Integer (Int) | 32 | 4 | 0 | 4,294,967,295 | 4,294,967,295 (232 or 4Gig) | >9 |
| Signed Integer | 32 | 4 | -2,147,483,648 | 2,147,483,647 | 4,294,967,295 (232 or 4Gig) | >9 |
| Long Integer (always signed) |
64 | 8 | A big negative number | A big positive number | 264 | >19 |
| Float (always signed) |
32 | 4 | ~ -1040 | ~ 1040 | 232 | ~7 |
| Double (always signed) |
64 | 8 | ~ -10300 | ~ 10300 | 264 | ~15 |
See: Integer Overflow, IEEE Standard 754 Floating Point Numbers
ArcGIS is not consistent in its terminology or support for numeric data types. Use the table below to remember the differences between attributes, rasters, and Geodatabases (which we'll talk about more later in the session). The numeric types that I recommend are the ones in bold. Also note that ArcGIS does not support a 64-bit (double) numeric floating point type. This can cause problems with some calculations but it is rare that 64-bits are needed.
| Name | ArcGIS Attributes | ArcGIS Rasters | Geodatabase |
| Unsigned byte | Unsigned 8 bit | ||
| Signed byte | Signed 8 bit | ||
| Unsigned short | Unsigned 16 bit | ||
| Signed short | Short Integer | Signed 16 bit | Short Integer |
| Unsigned Integer | Unsigned 32 bit | ||
| Signed Integer | Long Integer | Signed 32 bit | Long Integer |
| Float | Float | Floating-point 32 bit | Single-precision floating point |
| Double | Double | Double-precision floating point | |
| String | Text | Text | |
| Date | Date | Date |
Arc GIS documentation indicates that values in a GRID file are always stored as 32-bit values. See: Adding Fields to a Shapefile Attribute Table in ArcGIS, Bit Depth Capacity for Raster Dataset Cells, Technical Specifications for Raster Dataset Format
For rasters, Esri breaks up the numeric data type into a "Pixel Type" and "Pixel Depth". The "Pixel Type" will be unsigned, signed (both integers), and floating point (which is always signed). The "Pixel Depth" is then the number of bits per band. The reason I say "band" is because one pixel can represent multiple bands of data. The "Pixel Depth" is really the bit depth allocated for one band of data within a pixel. In other words, You can find the "Pixel Type" and "Pixel Depth" in the "Properties" dialog for a layer that contains a raster in ArcGIS. In ArcGIS Pro, this information is in the "Source" panel under "Raster Information".
Below are some common types for rasters:
| Data Set | Number of Bands | Pixel Type | Pixel Depth (band depth) | Notes |
|---|---|---|---|---|
| DEM | 1 | signed integer | 16 Bit | It's good to convert these to floating point for calculations |
| NAIP (CA Satellite data) | 3 (RGB) | unsigned Integer | 8 Bit | Common for display of color data |
| NLCD (Land Cover) | 1 | unsigned integer | 8 Bit | Common for coded data (see below) |
| PRISM (Climate Data) | 1 | floating point | 32 Bit | Becoming more common for rasters with measured or modeled values |
| LandSat | 1 | unsigned integer | 16 Bit | Each LandSat scene is made up of 7 bands but they are distributed as separate files to make it easy to access the data. |
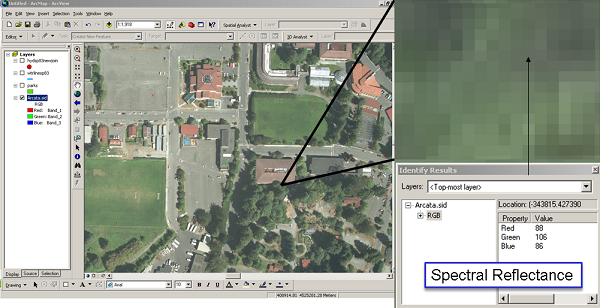
Most rasters used in GIS have just 1 band. However, the satellite photos you've been using have 3 bands, one each for red, green, and blue. The three bands together make the color images we see like the one below. These rasters are called true Color Composite or RGB rasters.
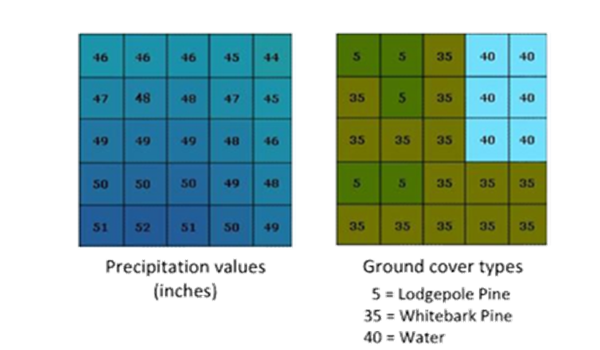
Most rasters will contain "measured values" or "computed values". This include just about any remotely sensed data I can think of including: visual, elevation, temperature, precipitation, thermal, etc. This also includes most computed or modeled data such as habitat suitability, risk of land slides or flooding, or amount of pollution. However, there are some rasters that include "codes". The codes are integer numeric values but also have a textural name and description of what they mean. The most common raster with codes is the National Land Cover Database. As with all rasters, remember that what is in the pixel does not correspond exactly to what is on the ground, there is always uncertainty in our data.
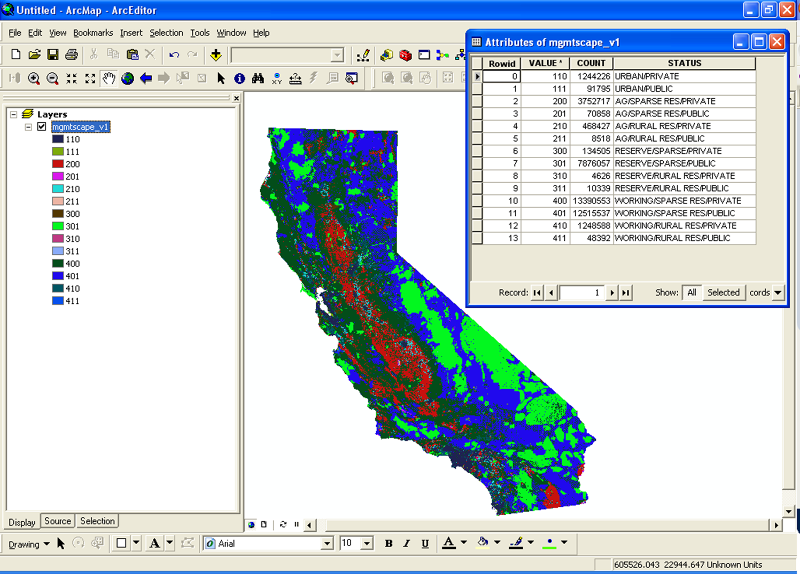
Below is an image in ArcGIS showing the "attributes" that provide the meaning for each of the codes in the pixels in the raster. Note that while these rasters are typically displayed in color, they are actually 1-band rasters where each code has been given a color.
© Copyright 2018 HSU - All rights reserved.